virtual spatial transcriptomics use case
Bring a spatial perspective to your molecular data.
A bulk RNA dataset can become the starting point for questions about where biology happens within the tissue. By including a sample-matched profile with its H&E slide, you can revisit familiar molecular findings through predicted spatial expression and investigate regions that the bulk measurement cannot distinguish.
Worked through for Pharma & Biotech and Biobanks.
The research opportunity
What spatial questions could you ask of the molecular data your study already holds?
Why it matters
Follow a molecular finding into the tissue
A gene of interest in bulk RNA gives you a starting point for spatial investigation. You might want to know whether its predicted expression concentrates in one region or extends across several structures. Gene maps let you examine those possibilities on the matching H&E image, bringing a spatial question to a result you already know.
While bulk RNA summarises expression across the sample, the predicted maps offer a view within it. You can relate the pattern to visible tissue structures and identify regions for closer study.
Build on measurements the study already made
Earlier molecular work can contribute to a new analysis of the same material. Because the bulk profile comes from the same tissue block as the slide, it provides sample-matched molecular context for the prediction. An existing profile can therefore take on a new role without collecting more tissue.
Revisit existing bulk RNA findings in their tissue context, using sample-matched profiles to inform predicted gene maps. Without a bulk profile, Aurora predicts from the slide alone.
Carry the question across the cohort
The same analysis can include samples with and without existing bulk RNA. The output uses a consistent gene panel and spatial format, so you can investigate a candidate across the collection with the same tools. Where a matching profile exists, it contributes to the prediction; elsewhere, Aurora works from the H&E image alone.
This lets you build on earlier measurements while keeping the wider collection in view. A finding in the profiled samples can prompt a spatial question that you investigate across other cases.
Explore the possibilities
The real-slide example shows the same section and genes predicted with and without its sample-matched bulk profile.
From a sample-level finding to a spatial question
MS4A1 and COL1A1 highlight different structures in this lymph node. Compare the predicted maps with and without the sample-matched bulk profile to consider how each gene relates to the tissue.
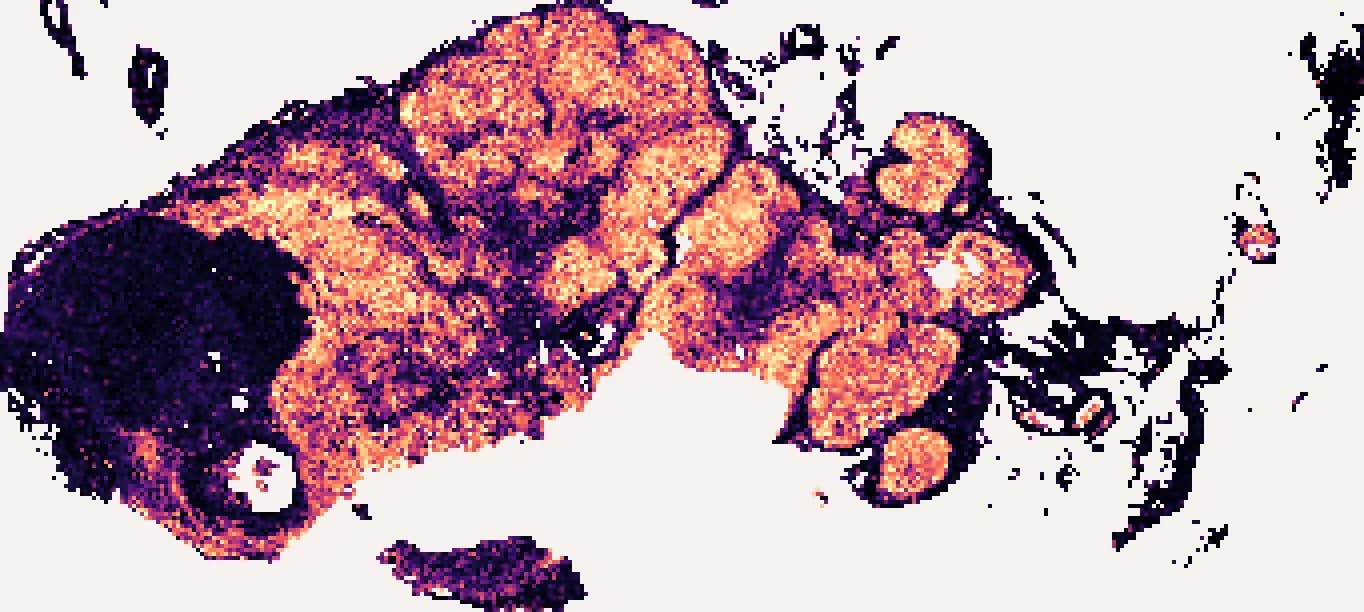
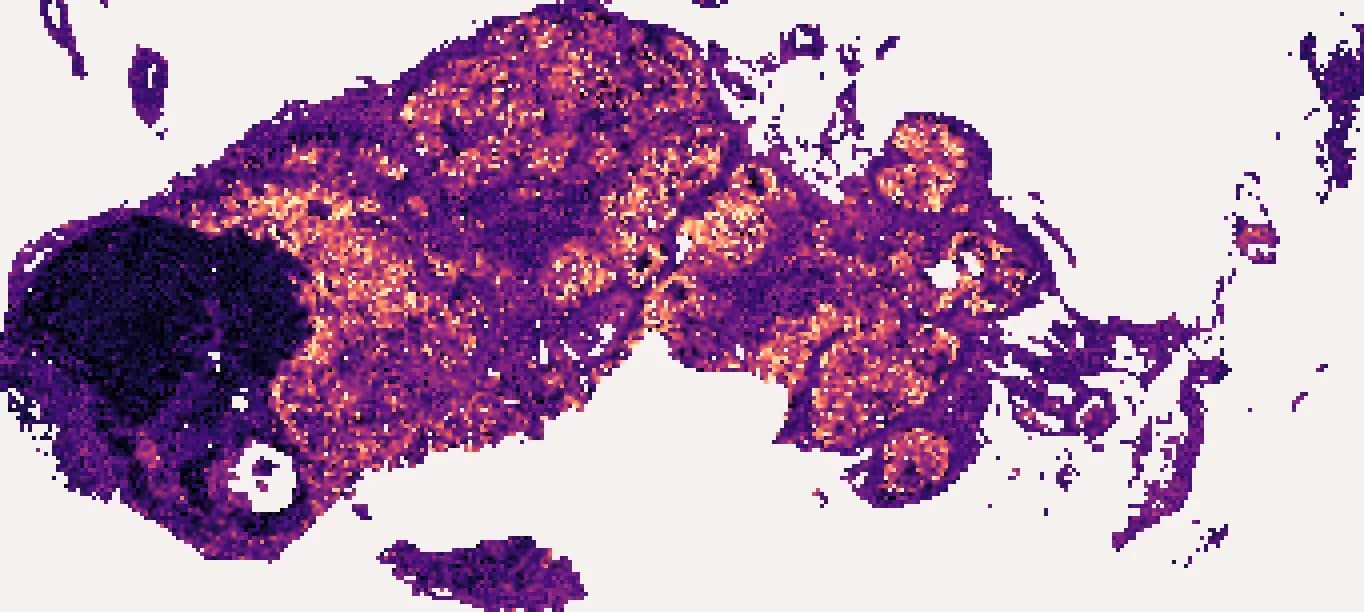
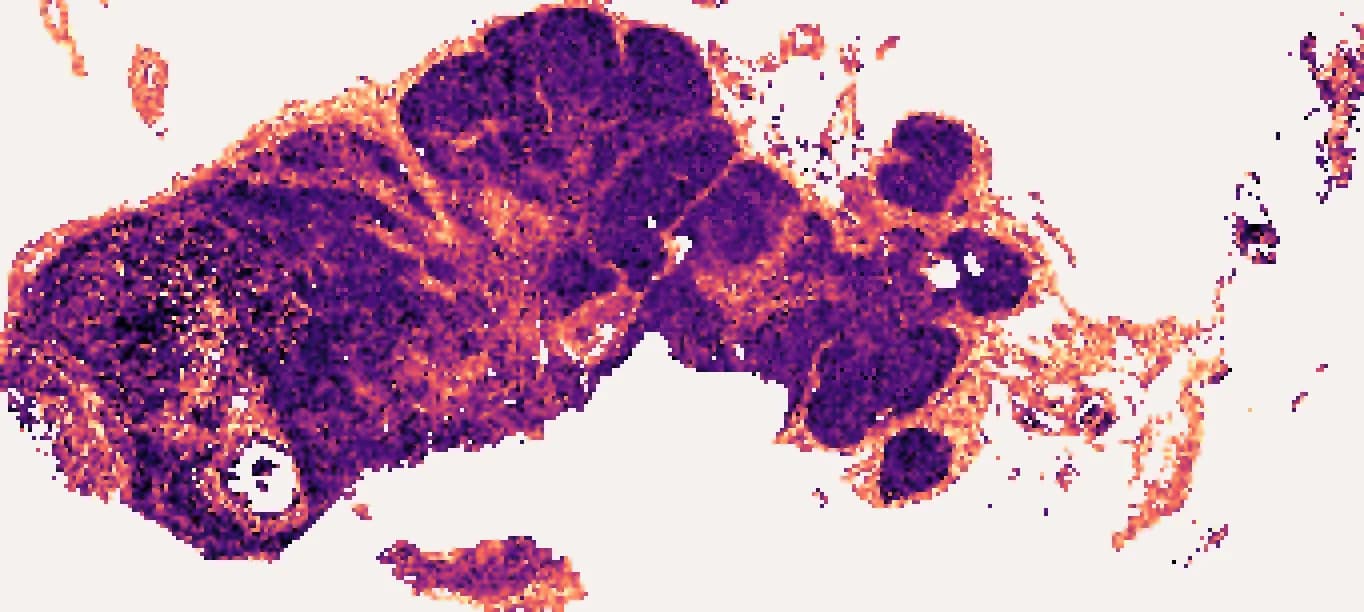
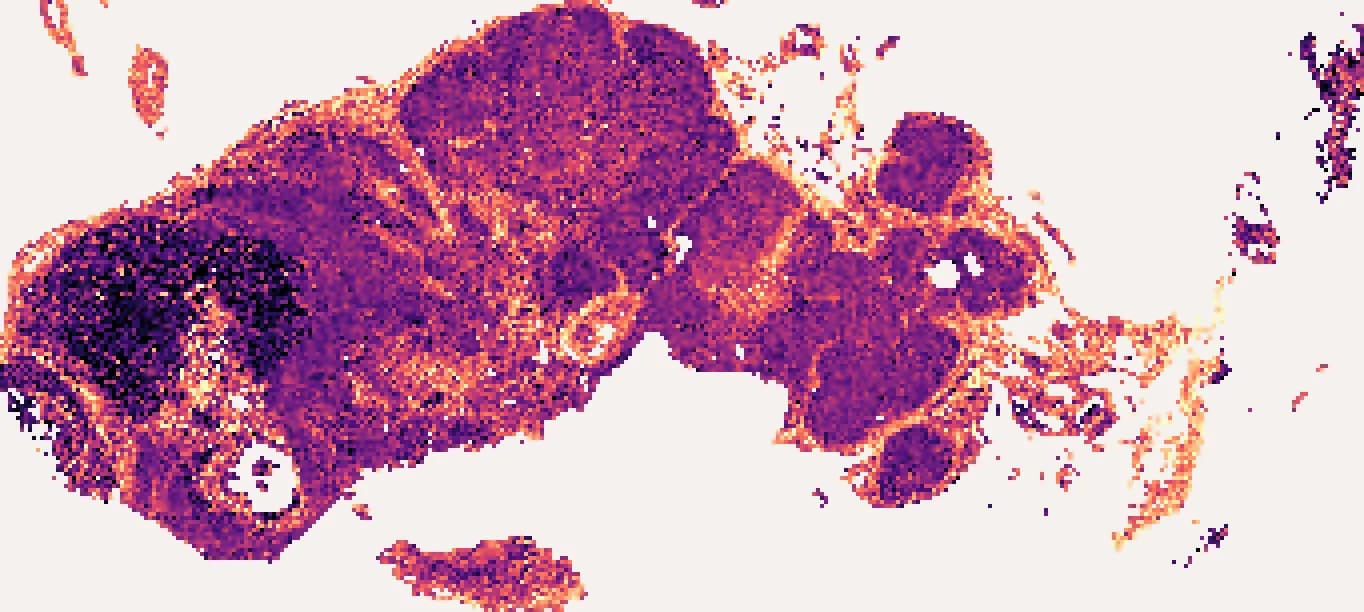
 higher
Your input and output
- Input
- A digitised H&E slide and a bulk RNA table from the same tissue block.
- Output
- Virtual spatial transcriptomics at every retained tile, informed by the sample-matched profile.
Take the next step
Start with an example slide, or talk to us about your cohort.