virtual spatial transcriptomics use case
Shape your next experiment with a wider view.
Give your next spatial experiment a clearer focus before you commit tissue to it. By comparing predicted expression across candidate slides, you can bring molecular questions into sample selection, capture placement and panel design from the outset.
Worked through for Pharma & Biotech, Academia & Research, Sequencing & Core Facilities and Biobanks.
The research opportunity
Which combination of samples, regions and genes would let you examine the biology you care about?
Why it matters
Choose samples for the comparison you need
Study design begins with the differences you want to understand. You may want to investigate a candidate gene across contrasting cases, or look more closely at a pattern that appears in only part of the cohort. Predicted expression maps let you consider those possibilities while you are still choosing samples.
Because Aurora covers the same gene panel across candidate slides, you can examine the genes relevant to the question on each image. Histology and cohort information then help you judge which samples offer the comparison you need.
Place the assay around a biological question
Where you measure determines which relationships within the tissue you can study. A capture area spanning a boundary offers a different experiment from one centred within a single region. The whole-section prediction helps you weigh those choices and see how the surrounding tissue changes from one placement to another.
Although every capture area covers only part of the section, its placement can be considered in the context of the whole image. You can discuss the alternatives with colleagues and connect the final choice to the hypothesis.
Let the first view inform the gene panel
Patterns in the candidate tissue can suggest genes to carry into the experiment. If predicted expression varies between regions you want to compare, those genes become candidates to assess during panel design. This gives you a way to connect gene selection with the tissue you plan to measure.
Together, these decisions give the study a coherent starting point: samples chosen for a comparison, capture areas placed around it, and genes selected to examine it.
Explore the possibilities
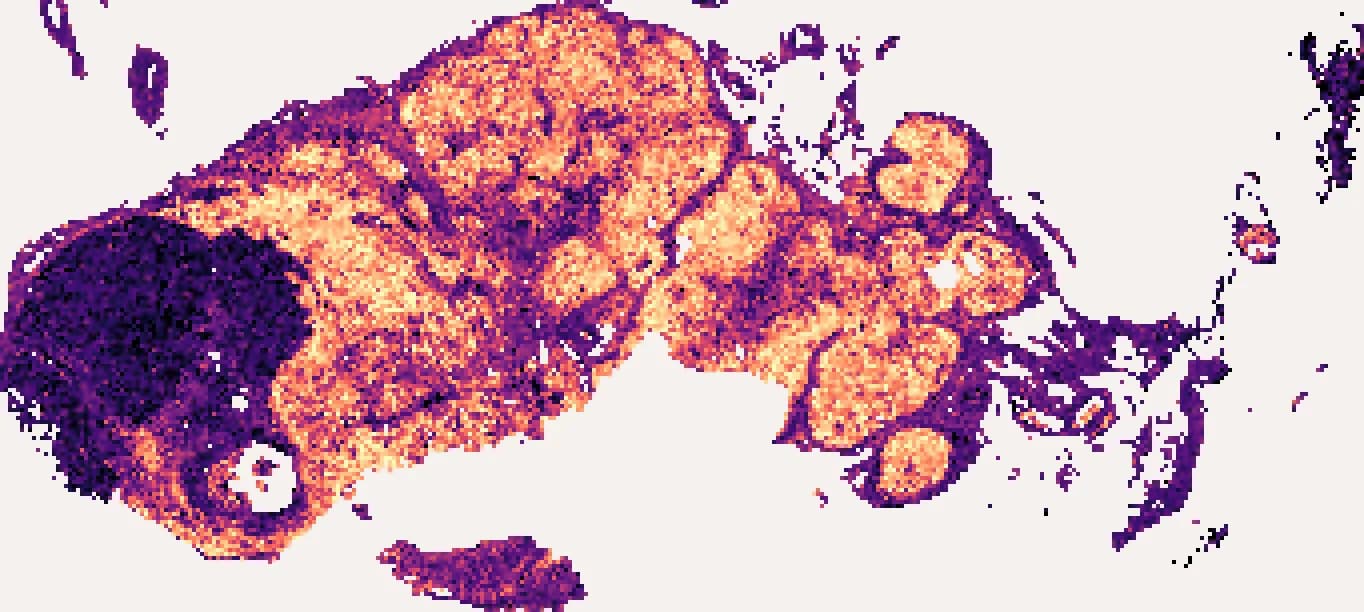
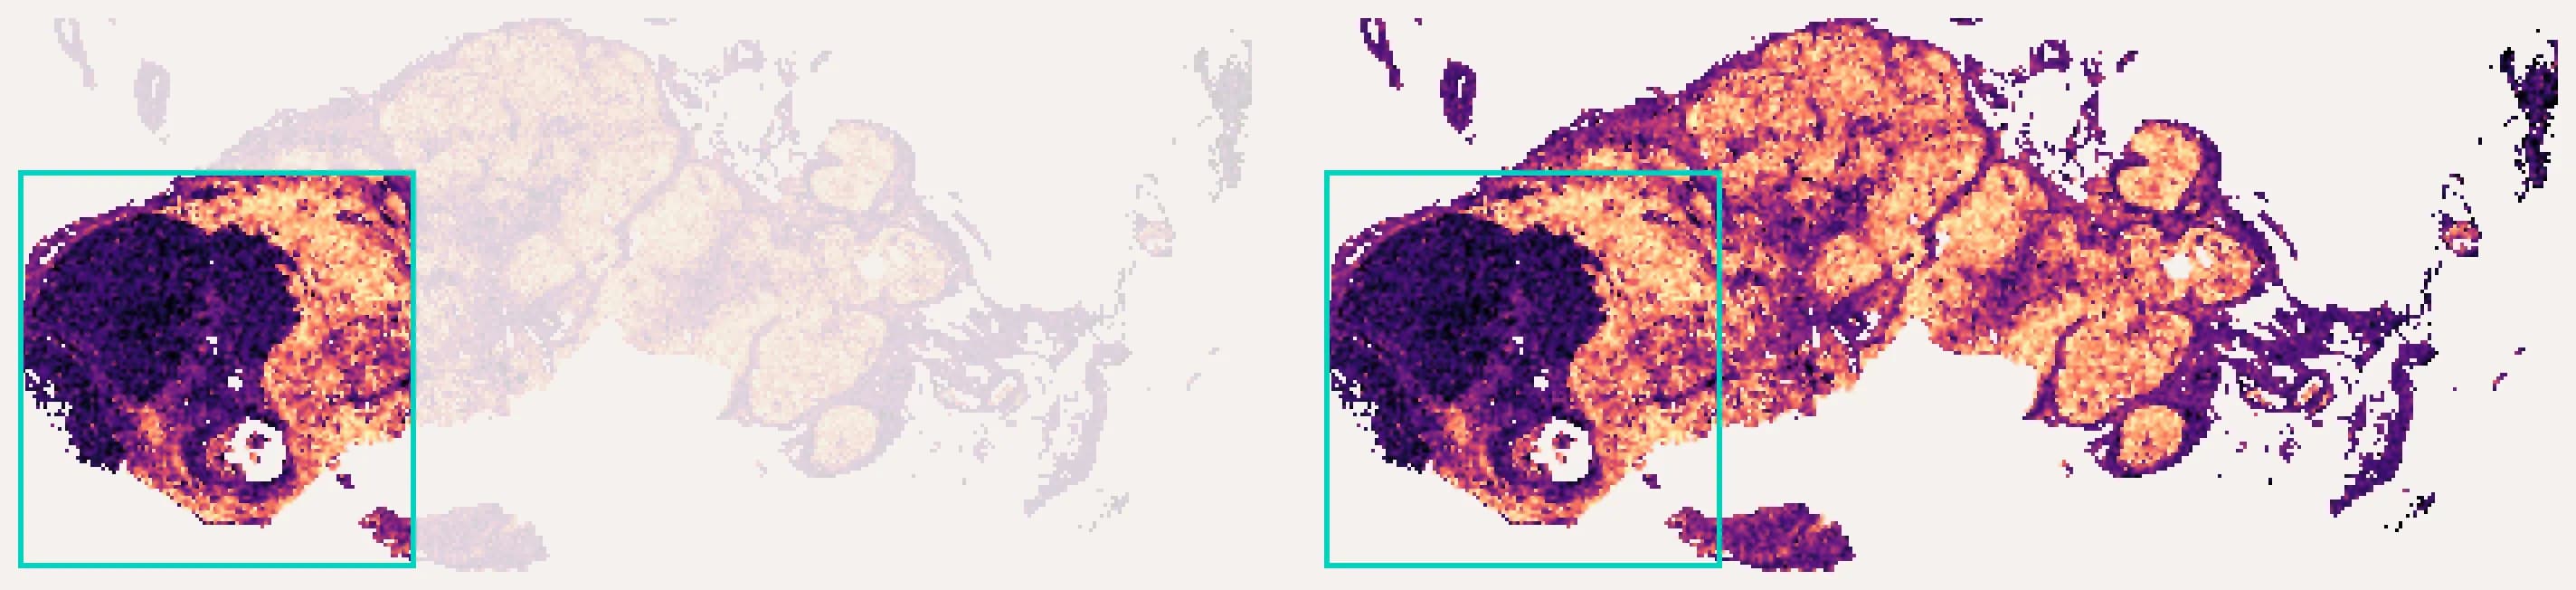
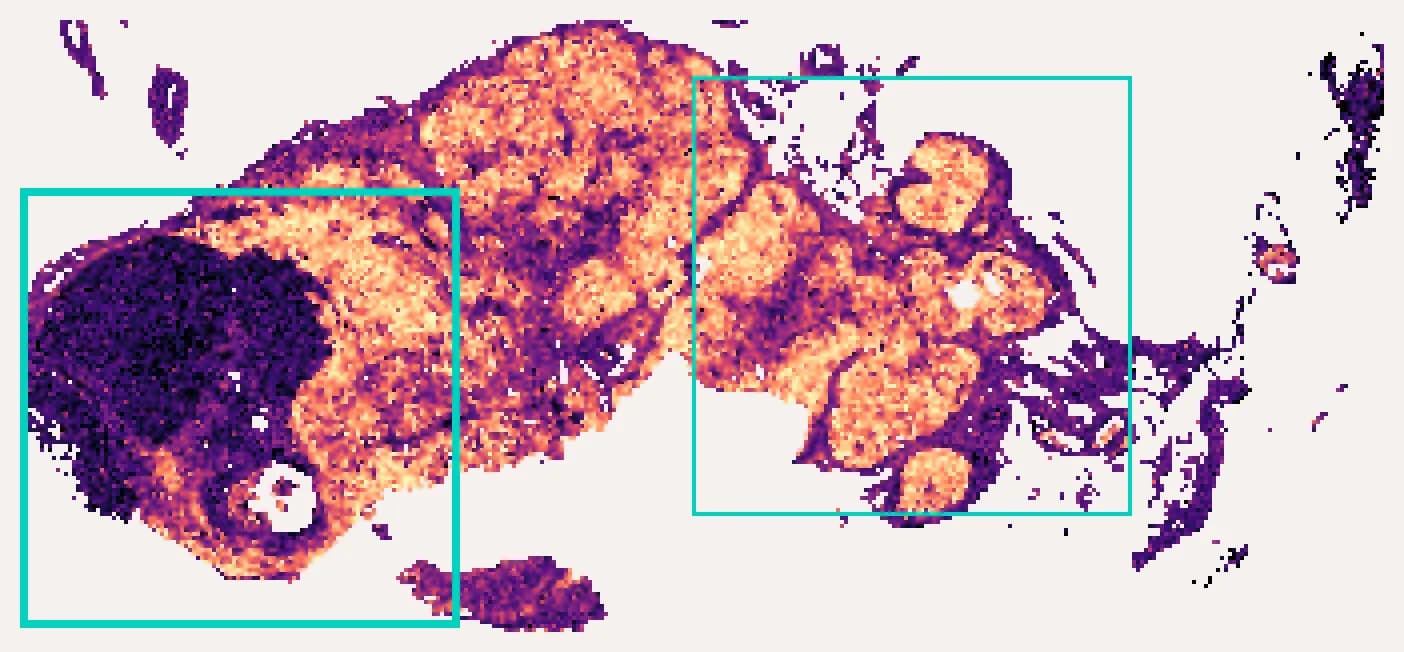
The whole-slide example below places a fixed capture area over a predicted gene map, showing how different placements include different parts of the tissue.
Explore what each capture area brings into the study
A placement across the tumour boundary includes different tissue from one centred within the lymph node. The predicted PTPRC map gives you a whole-section view for considering which comparison suits your question.
Your input and output
- Input
- The slides you are choosing between.
- Output
- Comparable virtual spatial transcriptomics on the same gene panel for every candidate.
Take the next step
Start with an example slide, or talk to us about your cohort.